

Shumoku とは
現実からずれない、再生成できるネットワーク地図
Shumoku はネットワーク構成を、手で描いて古くなる静的な資料ではなく、実データから生成・更新できる運用の地図として扱うためのオープンソースプロジェクトです。
YAML、NetBox、LLDP、SNMP、ネットワークスキャン、監視システム、独自 API などを起点に、ドキュメント、CI、Web アプリケーション、運用ダッシュボードで使えるトポロジーへ変換します。
構成図を、描いて古くなる資料から、実態に追従し続ける運用の地図へ。
把握できる
全体像と接続関係が一目で読み取れる。
信頼できる
古い資料ではなく、実ネットワークに基づく地図として扱える。
更新できる
構成変更に追従し、継続的に再生成できる。
運用できる
流量、状態、アラート、共有、ドキュメントを同じ地図上でつなげる。
Shumoku の構成
Shumoku は Server だけではありません。ライブラリ、レンダラ、CLI、設計ツール、運用アプリを組み合わせ、インフラの実データを運用できる地図へ変換します。
CLI / npm packages
YAML / JSON のトポロジーを SVG、interactive HTML、PNG に変換し、Markdown、ドキュメント、CI、製品組み込みで使えます。
CLI ドキュメント →連携
トポロジーをコードで定義

DCIM/IPAM から自動検出
SNMP + LLDP でシード機器からトポロジーを自動探索

インフラからトポロジーを可視化

トラフィック・ホスト状態・アラート

SNMP & Node Exporter メトリクス

Webhook アラート
Instant On ポータルからホスト・メトリクス・アラートを取得
独自データソース
トポロジーをコードで定義
DCIM/IPAM から自動検出
SNMP + LLDP でシード機器からトポロジーを自動探索
インフラからトポロジーを可視化
トラフィック・ホスト状態・アラート
SNMP & Node Exporter メトリクス
Webhook アラート
Instant On ポータルからホスト・メトリクス・アラートを取得
独自データソース
機能
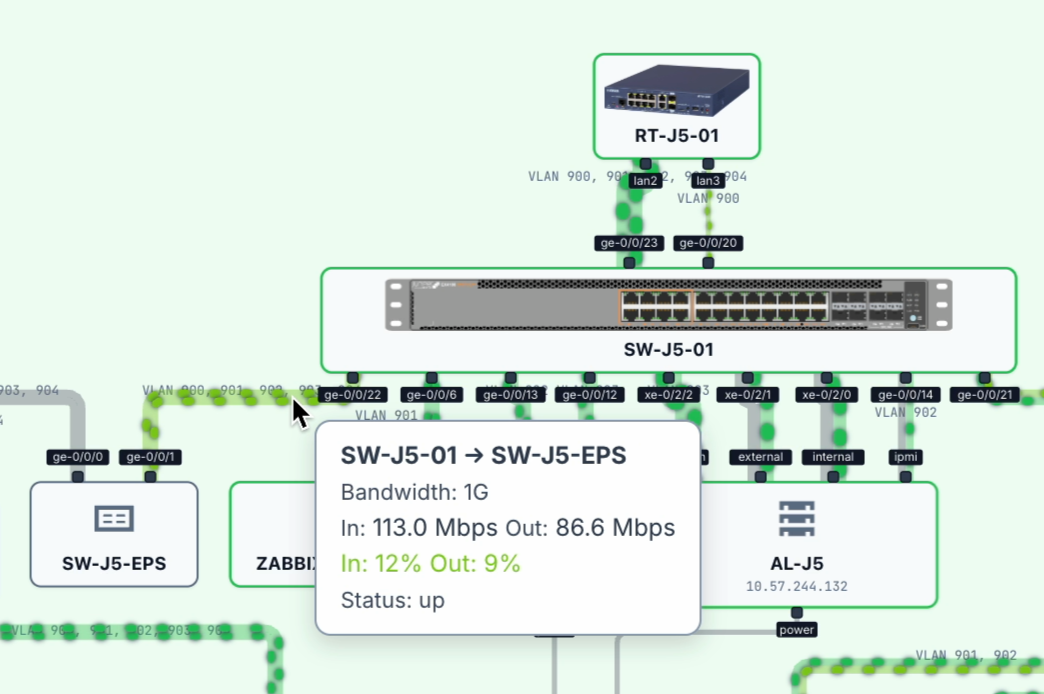
ライブ Weathermap
リンクのトラフィック使用率を負荷に応じて色分け表示
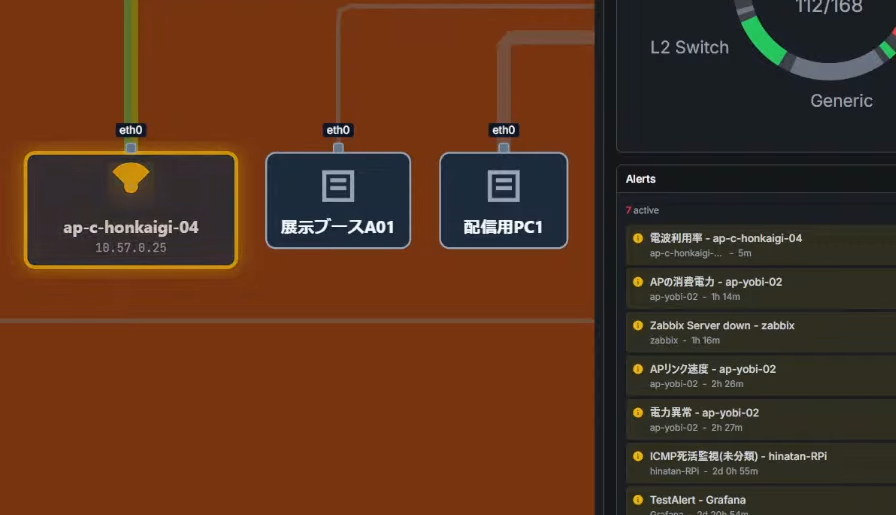
アラートオーバーレイ
Zabbix・Prometheus・Grafana のアラートをトポロジー上に表示
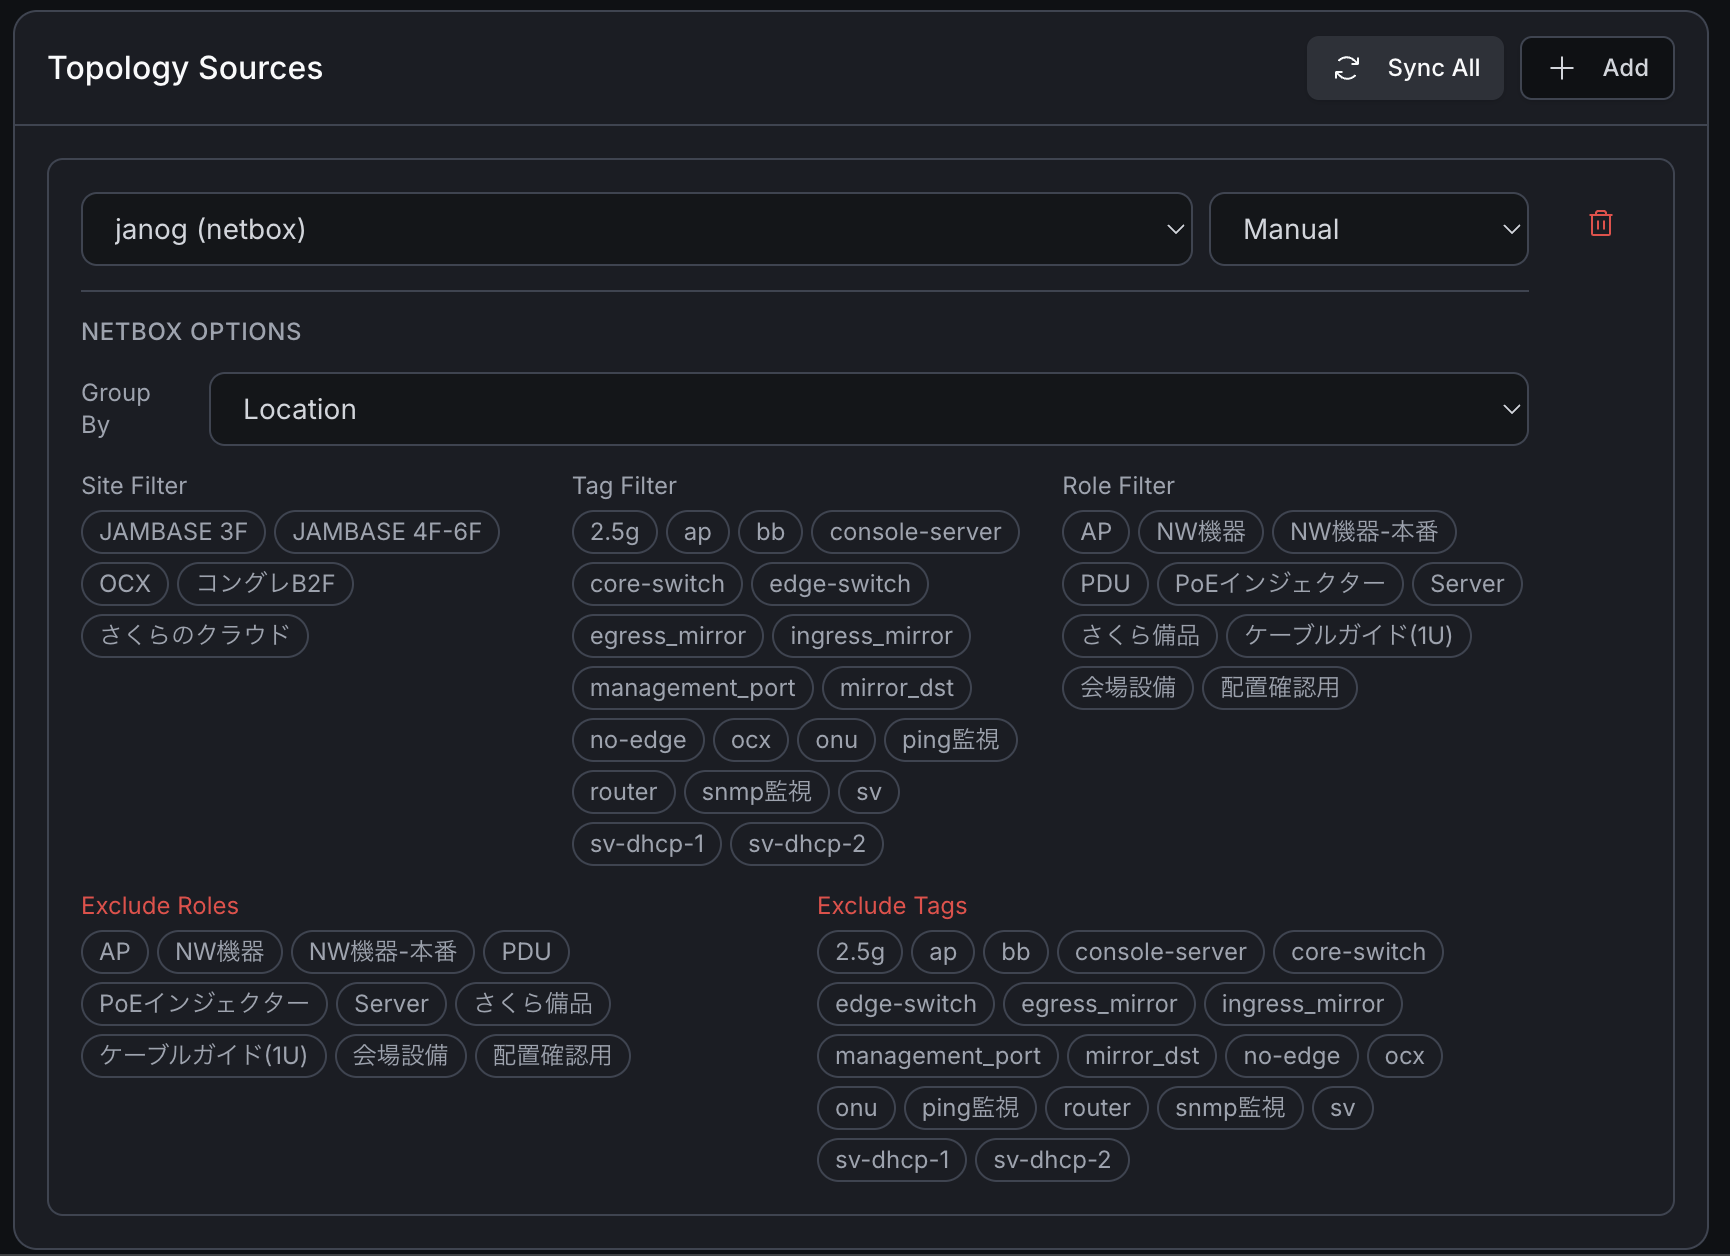
NetBox 自動生成
NetBox からデバイス・ケーブル情報を直接取得
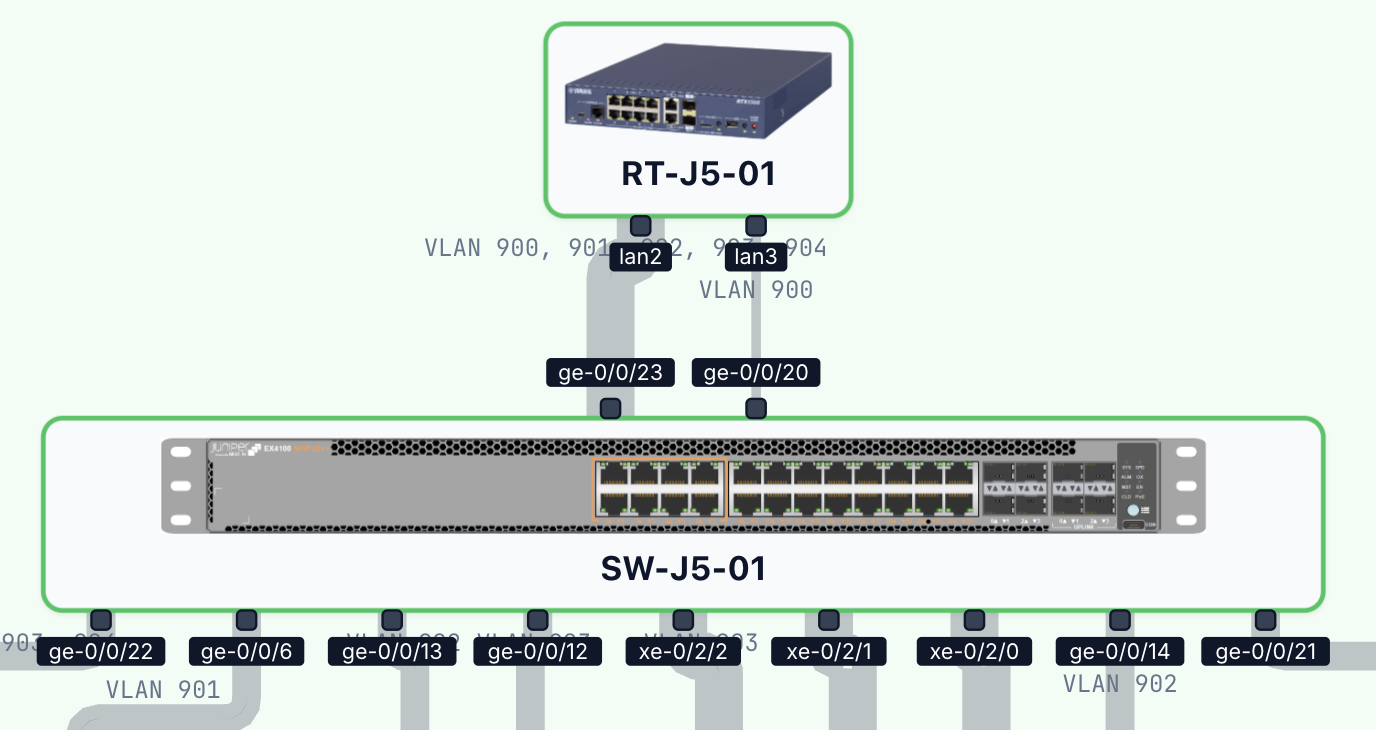
900+ ベンダーアイコン
Yamaha, Aruba, AWS, Juniper — 正しいアスペクト比
インタラクティブ操作
パン・ズーム・多階層ドリルダウン
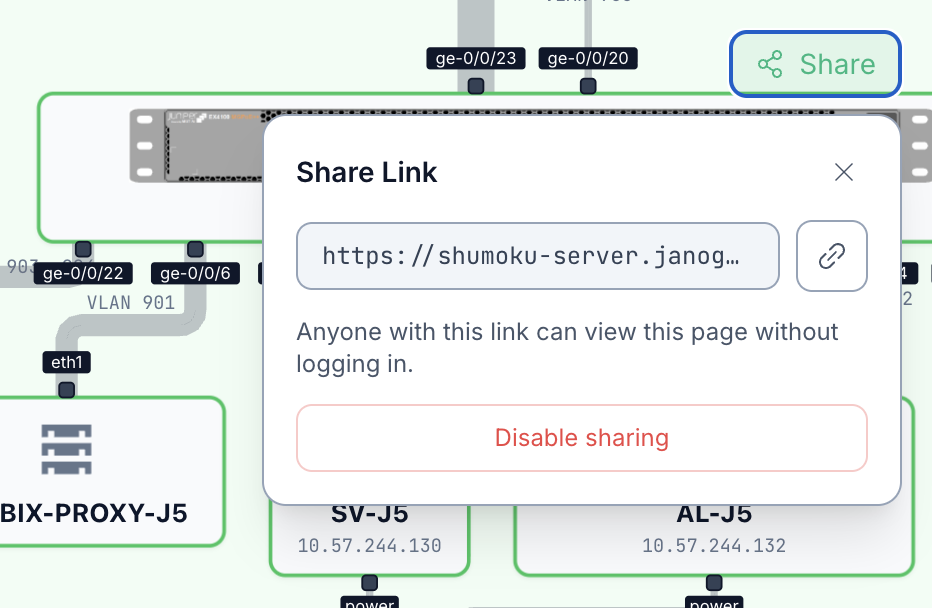
共有リンク
トークン付き公開ビュー — ログイン不要
ネットワークディスカバリ
SNMP + LLDP によるシードクロールでネットワークを自動探索。インベントリ不要。
専用レイアウトエンジン
ネットワーク構成図のために設計された階層レイアウトエンジン。汎用グラフライブラリではない。
本番稼働実績
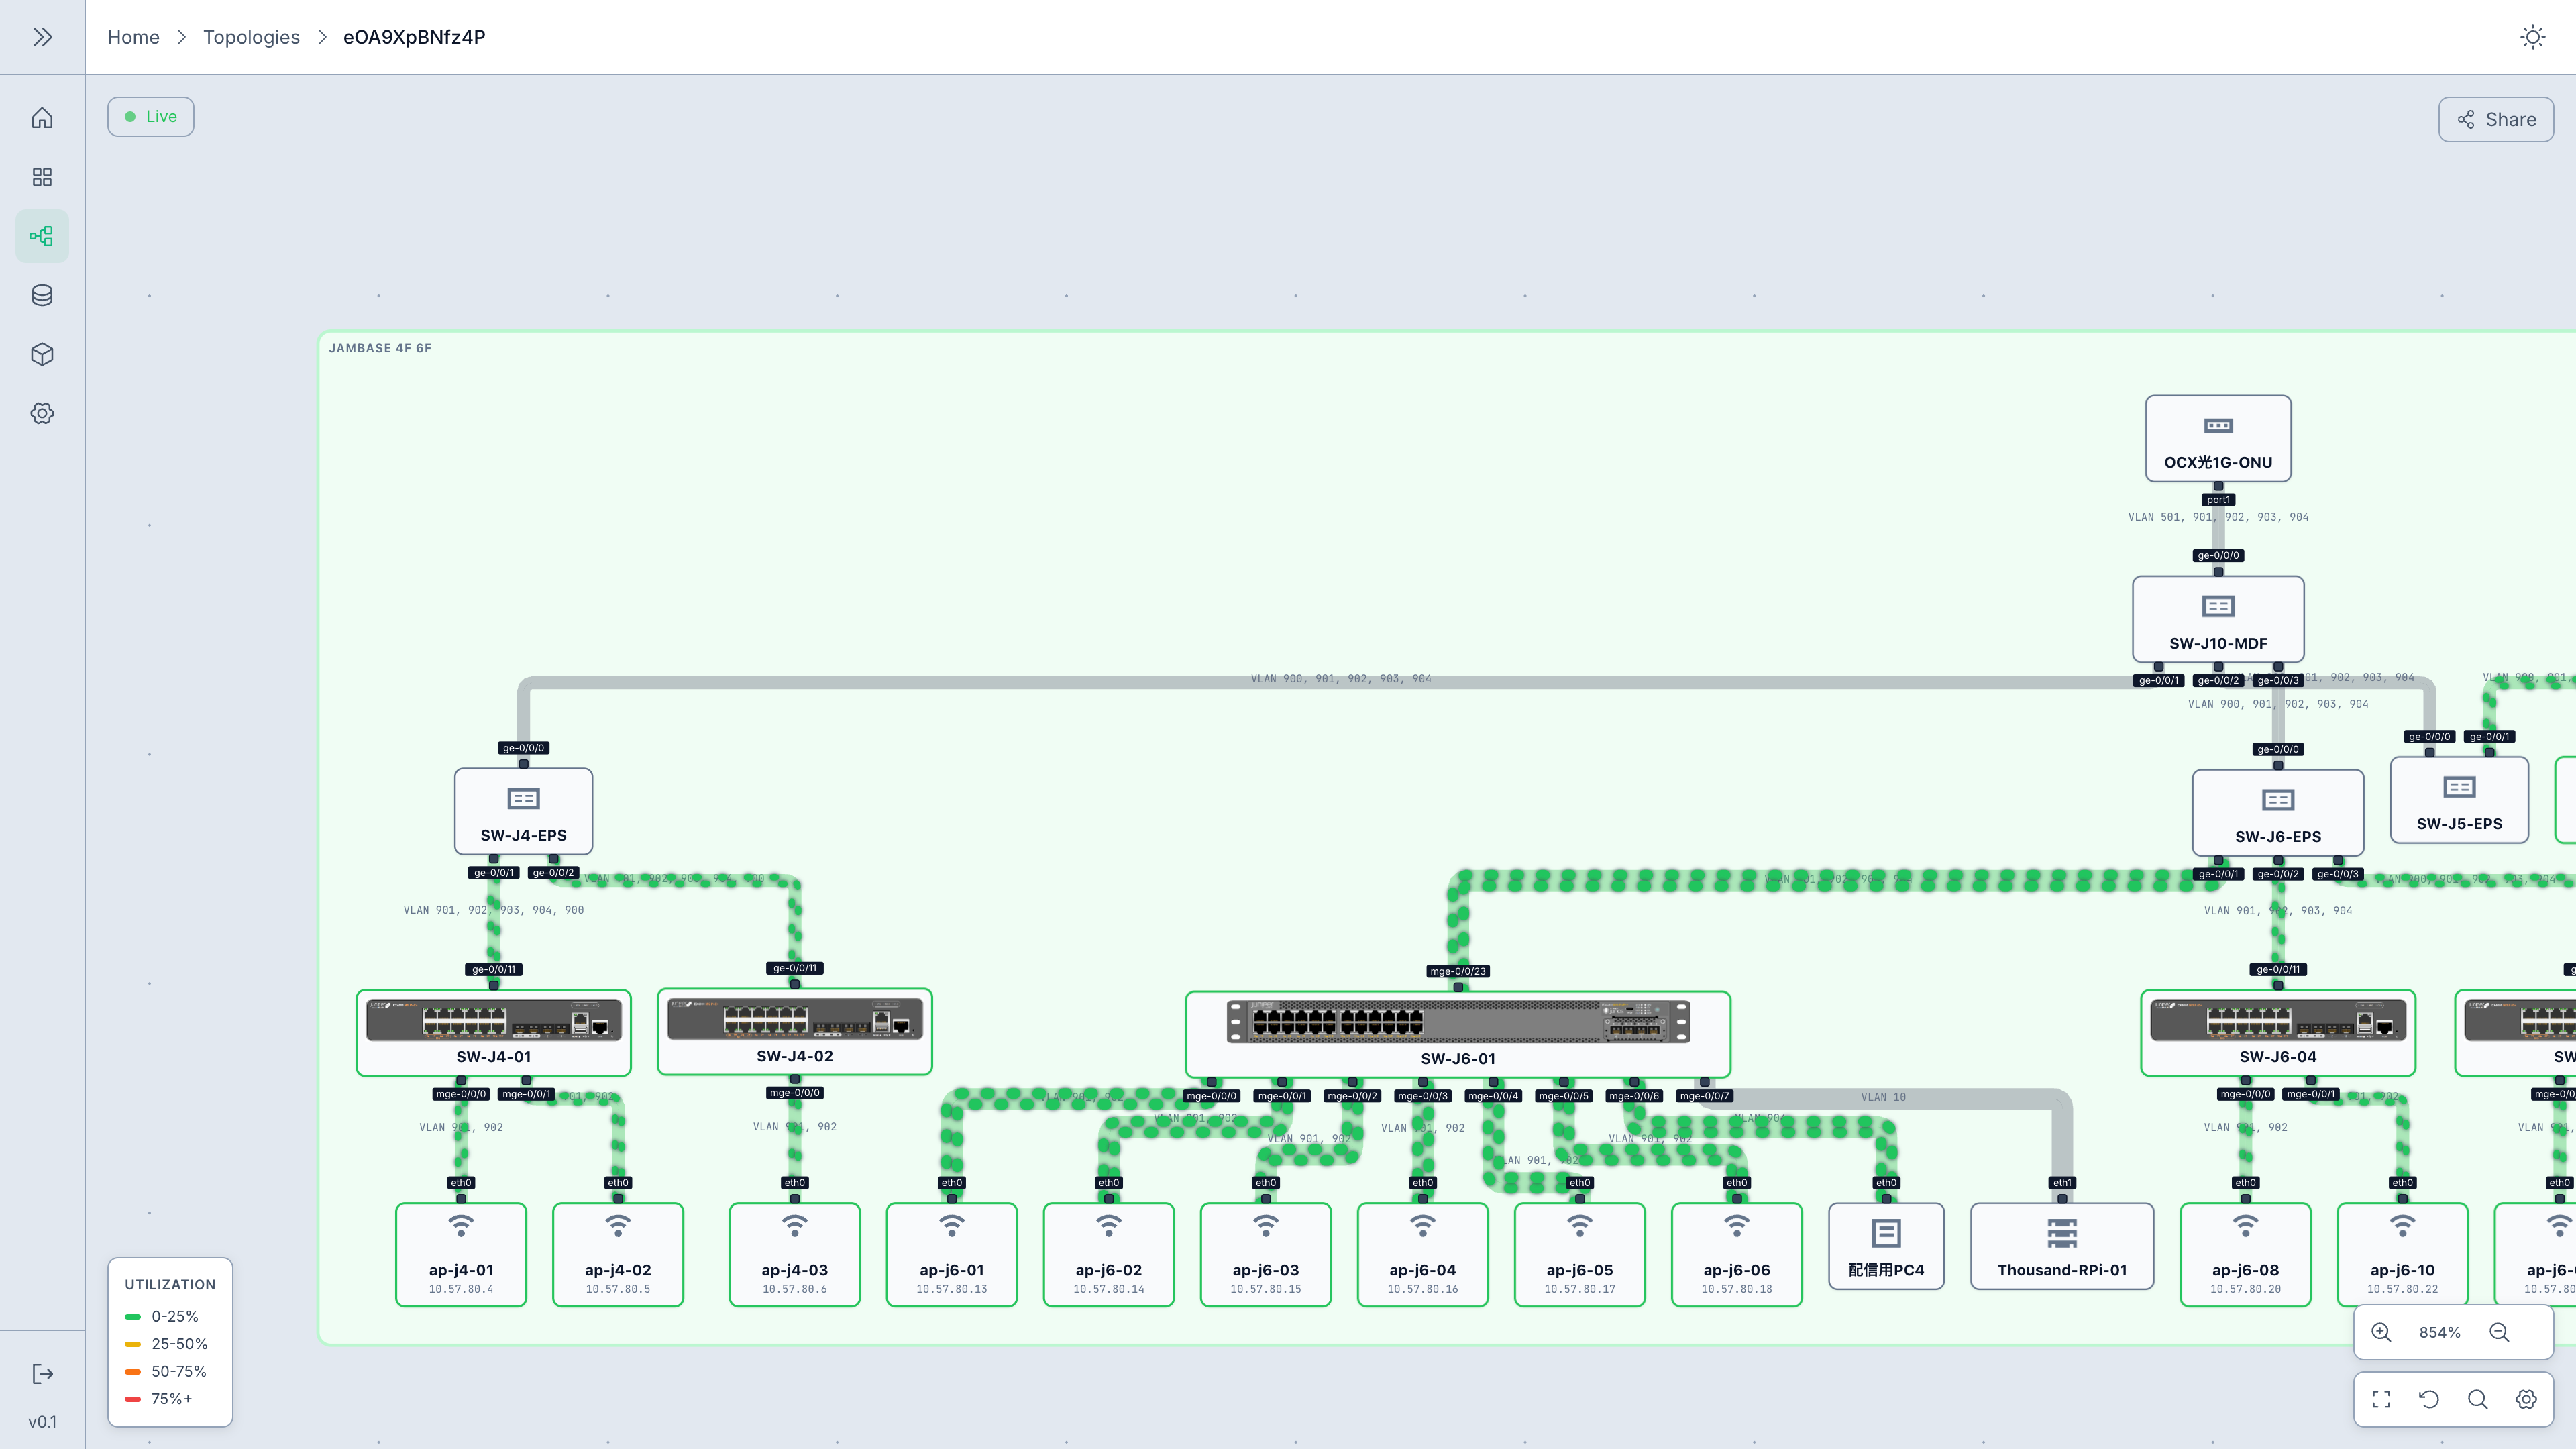
ライブトラフィック表示 — JANOG57 NOC
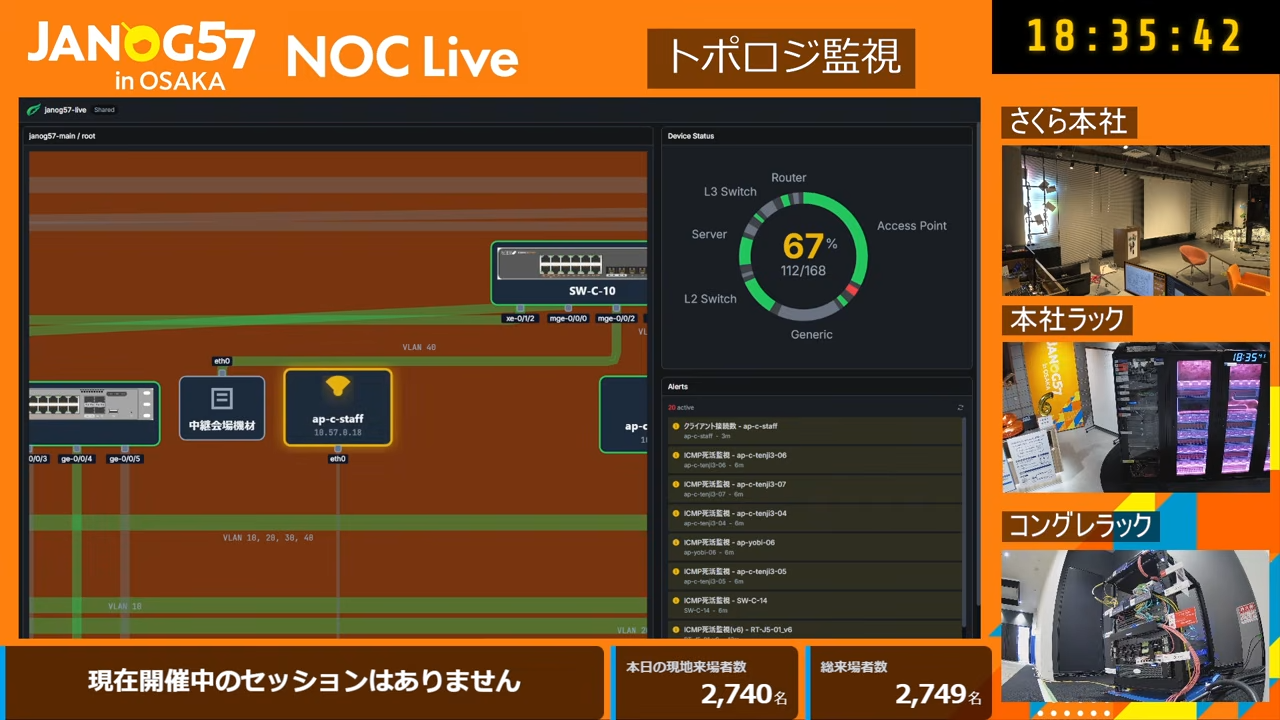
NOC ダッシュボード — JANOG57
“静的なトポロジー図を自動生成のライブトポロジーに置き換え。JANOG57 NOC で本番運用。NOC Liveで配信。”
NOC BBチーム — JANOG57
“Zabbix 連携でキャンパスネットワーク監視に導入。1日で Weathermap が稼働。”
インフラチーム — 大学 NOC
Shumoku はただのソフトウェアではありません。
一緒に築いていく基盤です。
Shumoku と一緒に作る
Shumoku は AGPL-3.0 の OSS — 利用に商用契約は不要です。バグ報告・機能要望は GitHub で公開対応、特定環境の調査や応答保証は商用サポートの対象です。 商用サポートを見る →
背景と思想
About Shumoku
名前、ロゴ、設計思想は、どれも同じ考えにつながっています。ネットワーク図は構造を作るものではなく、すでに存在している接続関係に輪郭を与えるものです。
名前の由来
shumoku という名前は、喚鐘を鳴らす道具である撞木に由来します。ネットワーク運用の始まりを静かに支える小さな基点でありたい、という意味を込めています。
ロゴの由来
ロゴはガブリエルの羽をモチーフにしています。見えなかった構造が人の前に示される瞬間を表すしるしです。
思想
図は構造を作るのではなく、機器の接続、経路、依存関係としてすでに存在しているものに、読める形の輪郭を与えるものです。
商用サポート
OSS として使い、必要なところだけ商用で支える
Shumoku は AGPL-3.0 のオープンソースソフトウェアです。利用にあたって商用契約は不要です。商用サポートは、特定環境の調査、非公開サポート、期限付き対応、導入支援が必要な組織向けの独立した有償サービスです。
コミュニティと商用の境界
コミュニティ
再現可能なバグ報告、一般的な質問、機能要望、ドキュメント改善など、公開の場で議論できるもの。
GitHub Issues / Discussions / Discord
商用
特定環境の調査、非公開サポート、応答保証、期限付き対応、優先実装、要件対応の開発。
contact@shumoku.dev
商用サポートの範囲
商用サポートは TelHi Corporation(輝日株式会社)などの非独占的パートナーと協力して提供します。技術方針、ロードマップ、リリース、コミュニティガバナンスは Shumoku Project に帰属します。
FAQ
無料ですか?
Shumoku は AGPL-3.0 のオープンソースです。無料で利用でき、商用契約は不要です。本番導入向けに有償サポート・コンサルティング・カスタム開発を提供しています。
AGPL-3.0 は商用利用できますか?
AGPL-3.0 の条件に従って利用できます。商用サポートを受けることは、AGPL-3.0 の条件を変更するものではありません。AGPL が合わない具体的な事情がある場合は個別に相談してください。
PHP Weathermap との違いは?
トポロジーファースト UI、多階層ナビ、900+ ベンダーアイコン、ネイティブ連携、アラート、ダッシュボード、共有ビューを Shumoku Server の中で扱えます。Grafana は必須ではありません。
監視ツールなしでも使える?
はい。YAML、NetBox、ネットワークスキャン、custom plugin などからトポロジーを生成し、スタンドアロンのトポロジービューアとして利用できます。監視連携はオプションです。
NetBox がなくても使えますか?
使えます。YAML 定義、SNMP + LLDP の Network Scan、Zabbix の LLDP topology、custom plugin などの選択肢があります。
Shumoku Server と Editor の違いは?
Server は運用・監視のためのセルフホスト型 Web アプリケーションです。Editor は物理トポロジー、機器、モジュール、ケーブル、BOM、PoE analysis を扱う設計ツールです。
商用サポートは?
公開できるバグ報告・質問・機能要望は GitHub でのコミュニティサポートです。特定環境の調査、非公開サポート、応答保証、期限付き対応、カスタム開発は商用サポートの対象で、contact@shumoku.dev までご連絡ください。商用サポートは非独占的パートナーの TelHi Corporation(輝日株式会社)と協力して提供しており、唯一の公式代理店は存在しません。
商用サポートのセクションを見る →